Getting started with Traefik and Kubernetes using Azure Container Service
17 Oct 2017Traefik is a modern, dynamic load-balancer that was designed specifically with containers in mind. It is able to react to service deployment events from many different orchestrators, like Docker Swarm, Mesos or Kubernetes, and dynamically reload its configuration to route the traffic to these services.
Today we are going to explore how to get started with Traefik and Kubernetes using the Azure Container Service. It is really very simple to setup a complete Kubernetes cluster on Azure, including Traefik, using Azure Container Service (ACS) and the Helm management tool.
Basically the steps we need to go through are:
- Create a Kubernetes cluster in Azure using ACS
- Make sure you have the
kubectlcommand-line tool installed - Install Helm on your local computer
- Install Traefik on your cluster using Helm
- Deploy your application
Create a Kubernetes cluster in Azure using ACS
This is simple if you already have access to an Azure subscription. From the Azure management portal, just launch the Cloud Shell which gives you access to a fully configured Azure CLI (the az tool). You can also install and run az on your local computer.
Once you have access to az, launching a Kubernetes is just two steps.
First, create a resource group:
az group create --name my-k8s --location uksouth
Make sure to create the resource group in a location where the latest version of ACS (“ACS RP V2”) is available so that you get the latest version of Kubernetes as well. For example, I used UK South in this example, but there are many other locations available; just check the page linked above for the latest deployment status.
Second, deploy the cluster:
az acs create --orchestrator-type=kubernetes --resource-group=my-k8s --name=my-cluster
And that’s it! After a few minutes the az tool will report back with a bunch of resources it created in Azure.
az acs create has many more options allowing you to control all the aspects of the cluster configuration, like the number and size of nodes, the storage configuration, etc. Check out the complete az acs create documentation for the details.
Make sure you have the kubectl command-line tool installed
kubectl is Kubernetes’ command-line client. You might already have it installed, otherwise az can help you with that:
az acs kubernetes install-cli
If you prefer, you can download the latest kubectl client by following the official Kubernetes kubectl documentation.
az will also configure kubectl for you, so you can talk to your new cluster:
az acs kubernetes get-credentials --resource-group=my-k8s --name=my-cluster
Once kubectl is installed and in your path, you should be able to issue commands like:
kubectl cluster-info
Make sure kubectl is connected to the cluster you just deployed in Azure (it can connect to multiple clusters).
kubectl config current-context
Install Helm on your local computer
Helm will make your life so much easier. It is like apt-get or brew, but for Kubernetes: the best way to find, share and use software for your brand new Kubernetes cluster.
Installing it is braindead easy: get the latest release from the Kubernetes Helm GitHub repository, and save it somewhere in your path.
Then run:
helm init --upgrade
This will configure your local Helm client, and also deploy Tiller, the server portion of Helm (it will appear as a Pod in your Kubernetes cluster).
Helm is pretty cool and can do lots of magic; check out the Helm documentation to learn more.
Install Traefik using Helm
Traefik was designed with orchestrators like Kubernetes in mind, and it can be dropped right into your cluster with one easy Helm command. Under the cover, Traefik registers itself as an Ingress Controller, a Kubernetes component that is able to service Ingress Resources, which in turn are a way to describe how traffic should be routed to Kubernetes services from an external endpoint. It is a fairly deep topic and you can read more in the Kubernetes documentation for Ingress Resources.
The Traefik Helm Chart has a bunch of parameters, to get started I would suggest enabling the dashboard, which gives you a Web view of the routes and requests that Traefik is managing. Please read the docs carefully if you are using this in production, to avoid exposing sensitive data by accident.
helm install --namespace kube-system --set dashboard.enabled=true,dashboard.domain=traefik-ui.acs stable/traefik
This will deploy Traefik on your cluster, in the kube-system namespace, enabling the dashboard, and exposing the dashboard as a service routed based on the traefik-ui.acs host name. The Traefik chart will also display some useful instructions on retrieving its public IP address, but more on this below.
Let’s have a look at all this in more detail.
If you run the following command, you will list all the Helm releases, a.k.a. deployed packages:
> helm list
NAME                    REVISION        UPDATED                         STATUS          CHART           NAMESPACE
quelling-greyhound      1               Tue Oct 17 09:33:00 2017        DEPLOYED        traefik-1.11.5  kube-system
Your release will almost certainly have a different name. Now you can inspect this release using Helm, to display all the resources deployed by the chart.
> helm status quelling-greyhound
LAST DEPLOYED: Tue Oct 17 09:33:00 2017
NAMESPACE: kube-system
STATUS: DEPLOYED

RESOURCES:
==> v1beta1/Ingress
NAME                                  HOSTS           ADDRESS  PORTS  AGE
quelling-greyhound-traefik-dashboard  traefik-ui.acs  80       8h

==> v1/Pod(related)
NAME                                        READY  STATUS   RESTARTS  AGE
quelling-greyhound-traefik-353173870-lhjg8  1/1    Running  0         8h

==> v1/ConfigMap
NAME                        DATA  AGE
quelling-greyhound-traefik  1     8h

==> v1/Service
NAME                                  TYPE          CLUSTER-IP    EXTERNAL-IP   PORT(S)                     AGE
quelling-greyhound-traefik-dashboard  ClusterIP     10.0.101.178  <none>        80/TCP                      8h
quelling-greyhound-traefik            LoadBalancer  10.0.18.81    51.140.74.40  80:30979/TCP,443:31299/TCP  8h

==> v1beta1/Deployment
NAME                        DESIRED  CURRENT  UP-TO-DATE  AVAILABLE  AGE
quelling-greyhound-traefik  1        1        1           1          8h
So basically Traefik was installed as a Deployment inside the cluster, by default using a single Pod. You can read more about scaling Traefik in its Kubernetes user guide.
If we inspect this Pod, we see that it exposes three ports, 80 (http), 443 (https) and 8080. The latter exposes the Traefik dashboard, which is a nice way to check what is going on. Note that you need to specify --namespace kube-system to display these resources.
> kubectl describe pod quelling-greyhound-traefik-353173870-lhjg8 --namespace kube-system | grep Ports
    Ports:              80/TCP, 443/TCP, 8080/TCP
Now let’s look at the Services; we have two of them:
quelling-greyhound-traefik-dashboardexposes the dashboard as a Cluster IP, meaning that it is only visible internallyquelling-greyhound-traefikis the actual Traefik controller, and it is exposed as an Azure Load Balancer, with an external IP address
When you initially deploy the chart, the external IP will be marked as <pending> while it is being allocated by Azure. You can wait for the IP address using kubectl:
kubectl get svc quelling-greyhound-traefik --namespace kube-system -w
But wait, there is more! When we deployed Traefik using Helm, remember we asked for the dashboard to be actually exposed using a host name. So the chart went ahead and also deployed an Ingress resource that actually exposes the dashboard Service to the outside world:
> kubectl get ingress --namespace kube-system
NAME                                   HOSTS            ADDRESS   PORTS     AGE
quelling-greyhound-traefik-dashboard   traefik-ui.acs             80        8h
So this means the dashboard is pretty much ready to receive requests, but only if the requests come in with the right host name: traefik-ui.acs. Because this host name does not exist, we will need to fake it by editing our local hosts file. This is a pretty common trick, just edit /etc/hosts on Linux or %WINDIR%\System32\drivers\etc\hosts on Windows (you will need superuser privileges in both cases). Add an entry for traefik-ui.acs and point it to the EXTERNAL-IP from the Traefik service above.
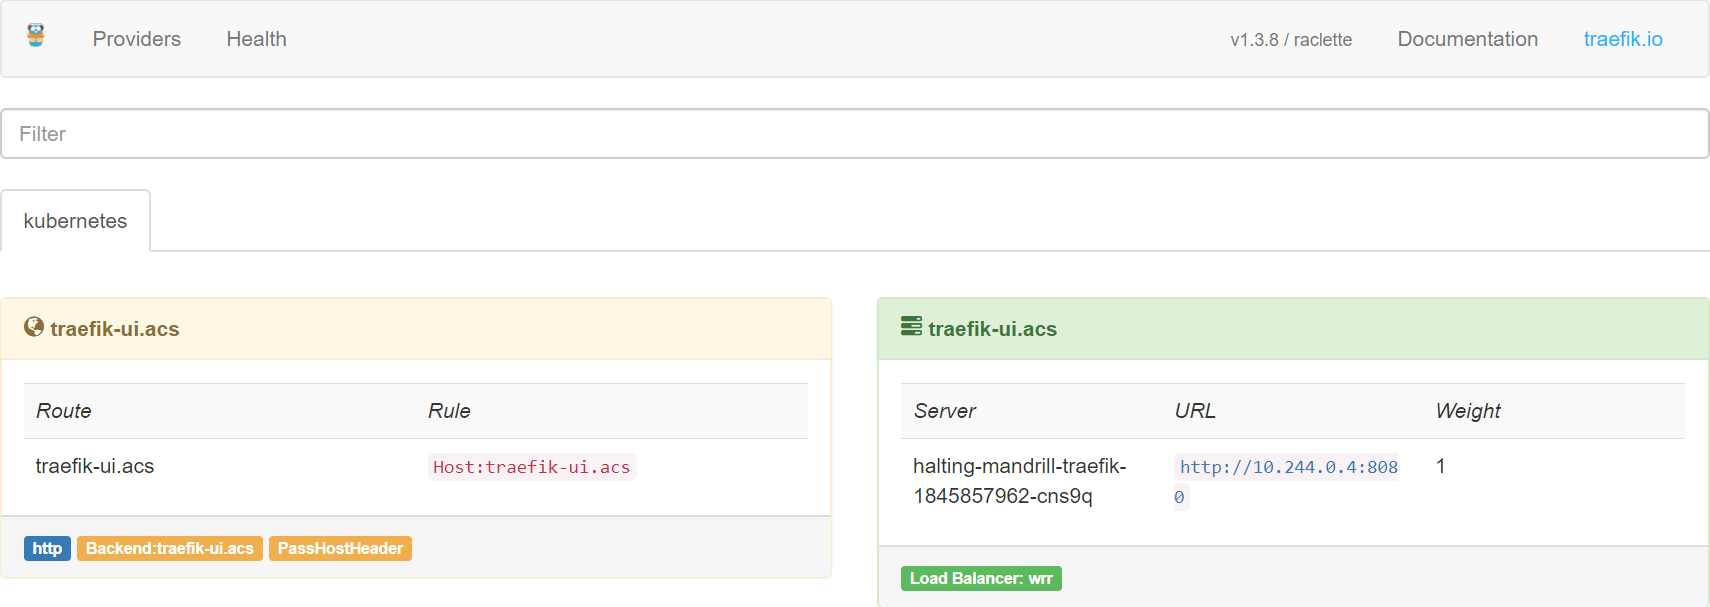
Now you should be able to point your browser to http://traefik-ui.acs/ and see the Traefik dashboard!

Deploy your application
Now Traefik is ready to go and configured as an Ingress Controller. You can just deploy apps and expose them using Ingress Resources, and Traefik will automatically pick them up. Let’s give it a try.
I am going to deploy a simple demo app, the one from the excellent book Kubernetes up and running. Below you will find a YAML manifest file that deploys three instances of the KUAR Demo application. Note that it uses and Ingress to expose the application publically, without specifying a hostname, which means the application will be the one available by default when using just the IP address.
apiVersion: apps/v1beta1
kind: Deployment
metadata:
  name: kuard-deployment
  labels:
    app: kuard
spec:
  replicas: 3
  selector:
    matchLabels:
      app: kuard
  template:
    metadata:
      labels:
        app: kuard
    spec:
      containers:
        - image: gcr.io/kuar-demo/kuard-amd64:1
          name: kuard
          ports:
            - containerPort: 8080
              name: http
---
apiVersion: v1
kind: Service
metadata:
  name: kuard-service
spec:
  selector:
    app: kuard
  ports:
  - port: 80
    targetPort: 8080
---
apiVersion: extensions/v1beta1
kind: Ingress
metadata:
  name: kuard-ingress
  annotations:
    kubernetes.io/ingress.class: traefik
spec:
  rules:
  - http:
      paths:
      - backend:
          serviceName: kuard-service
          servicePort: 80
Just save this into a YAML file, and apply it using the following command:
kubectl apply -f kuard.yaml
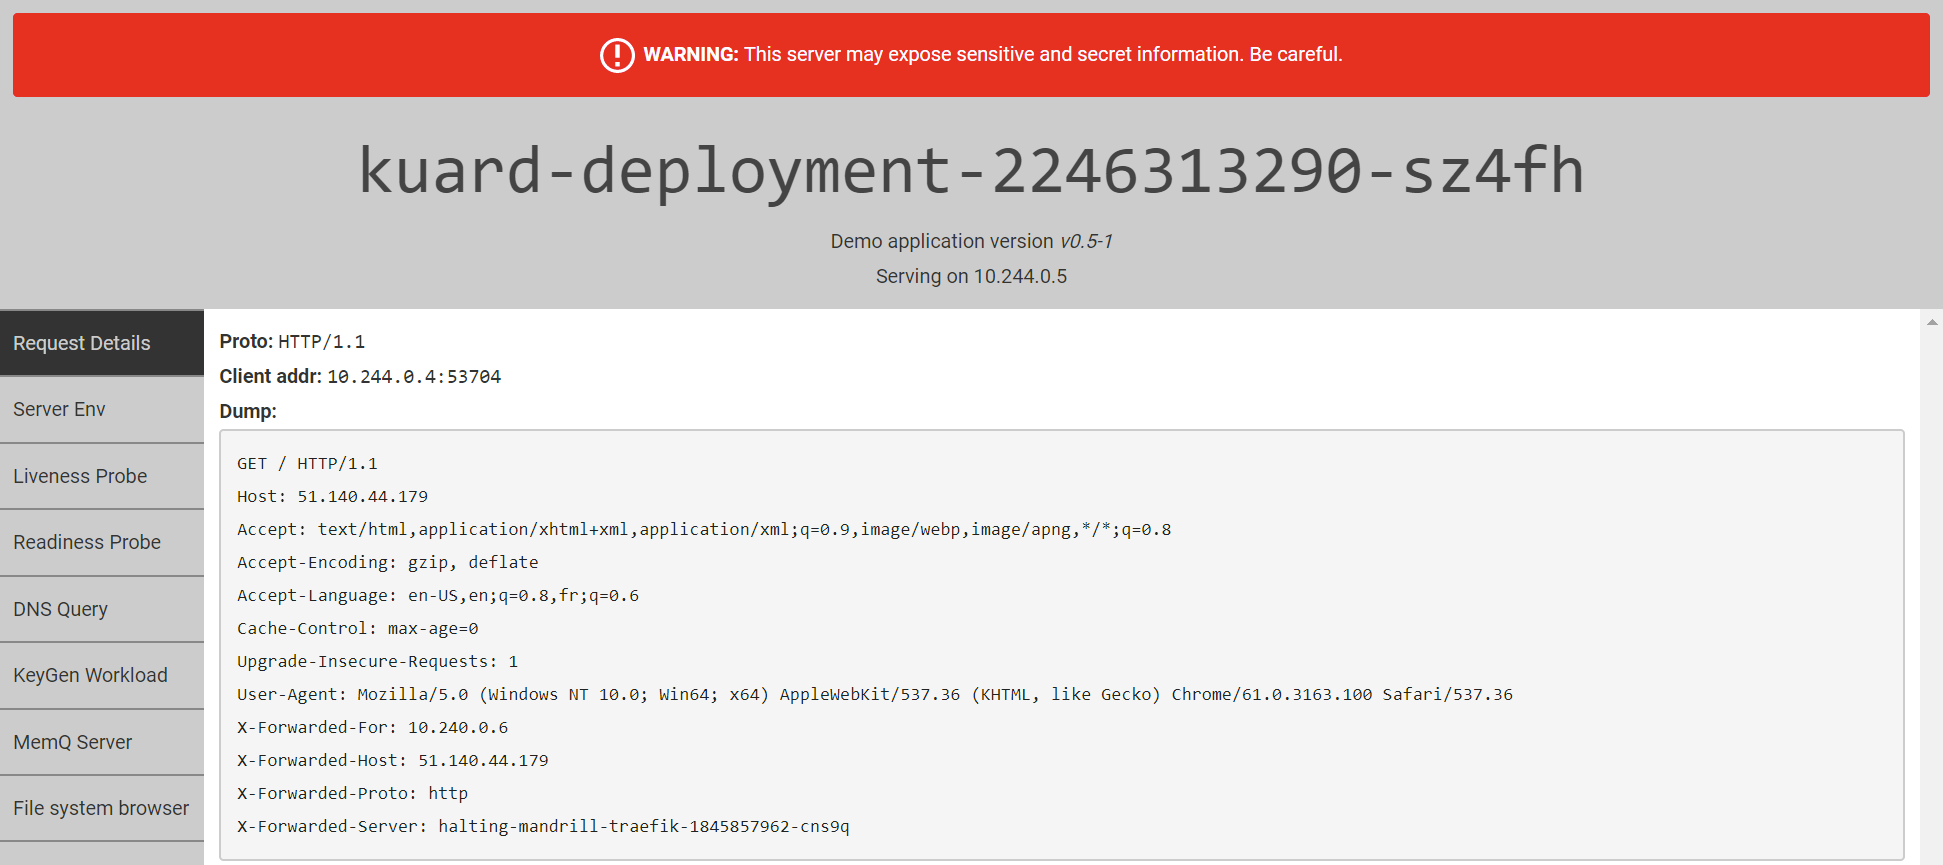
Now you can open the Traefik IP address in your browser, and you should see the KUAR Demo application come up. Refresh the page a few times, and you should see the host name change as Traefik load-balances the requests across the different instances.

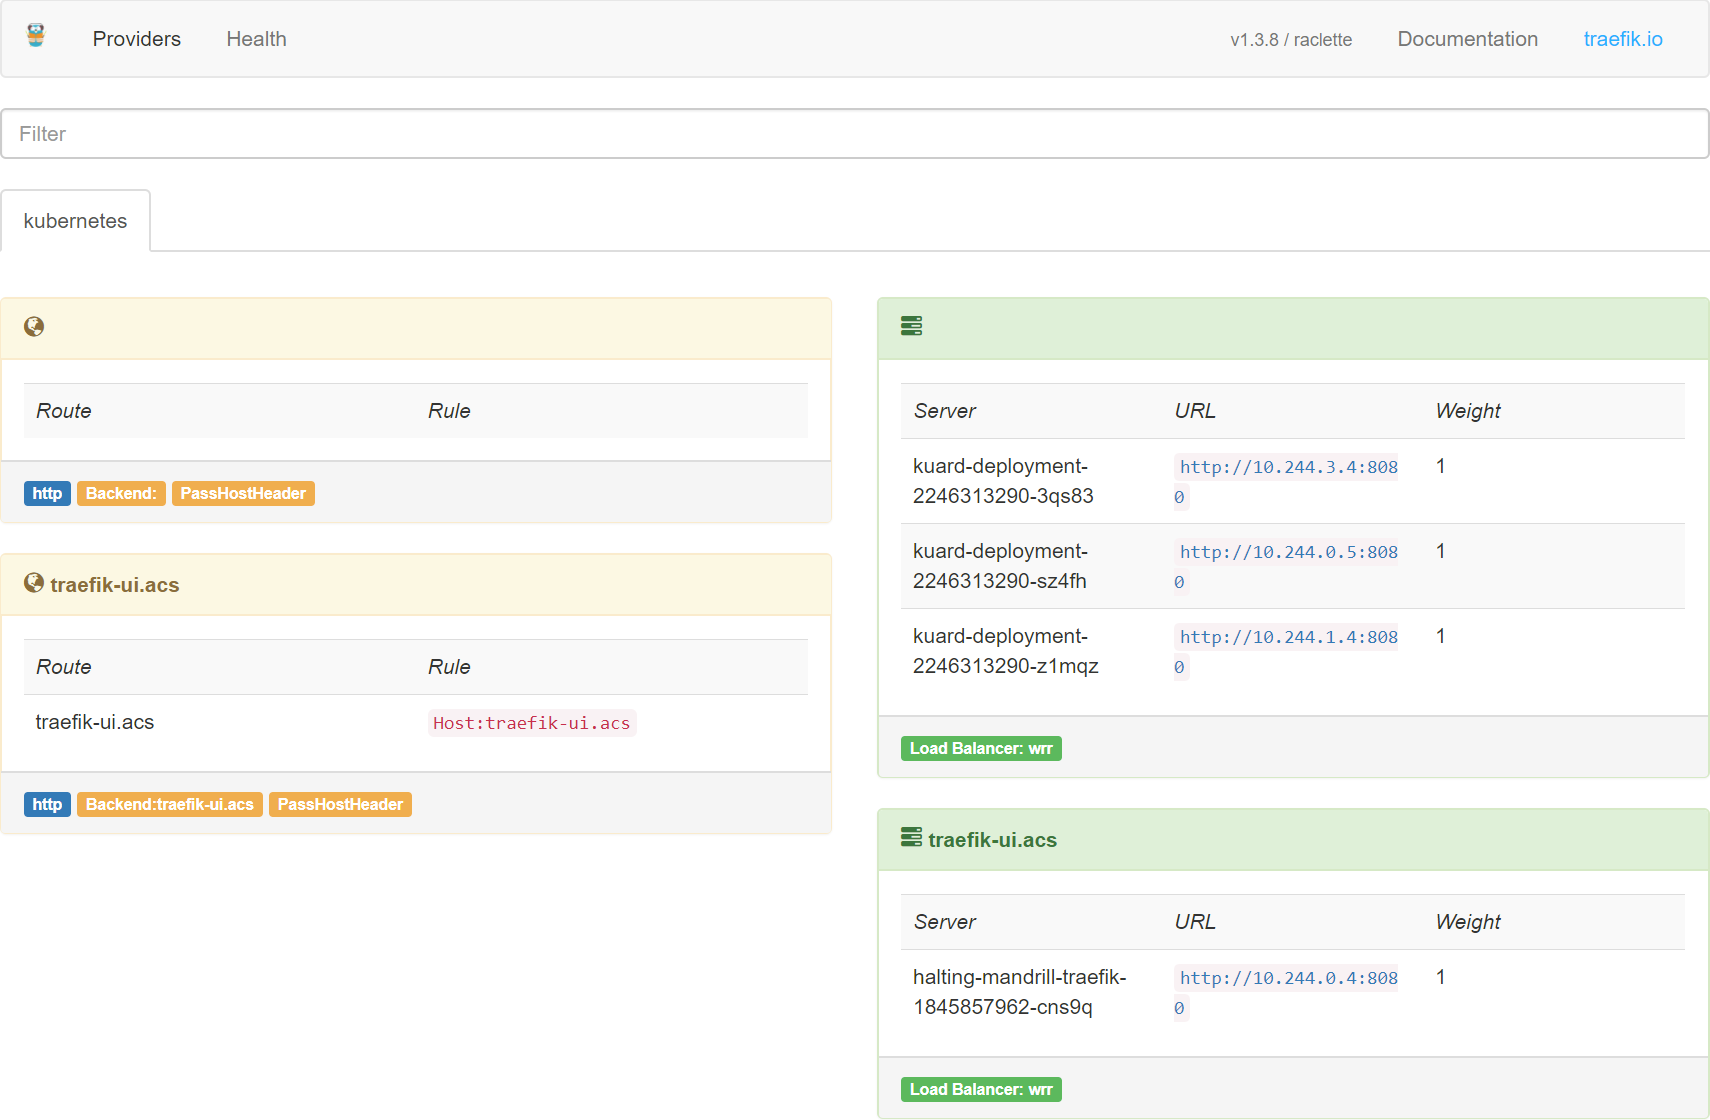
You can alos go back to the Traefik dashboard, and you will see that the new configuration has been taken into account.

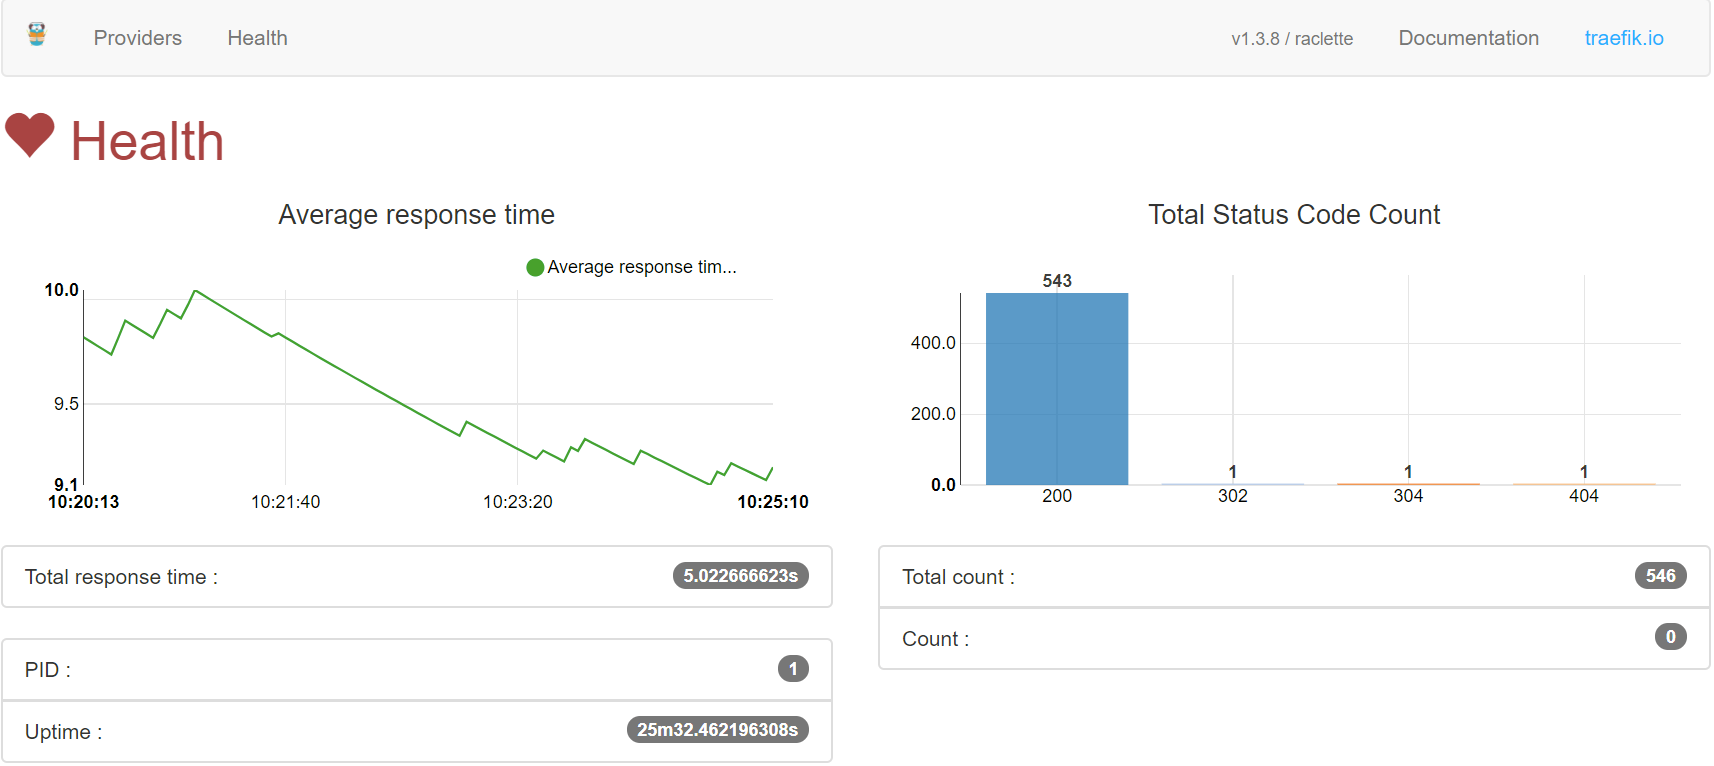
The Health tab will show you some simple metrics about the traffic to your applications.

And that’s it! Traefik has many more configuration options, like rewriting and routing rules, Let’s Encrypt support, circuit breakers, etc. So make sure to check out the Trafik docs for more details.